Number of Teams Views per day.
Code here: numbers.ipynb
Use the panel on the right to zoom, pan, and scroll. NB: Microsoft Teams data only available from 2 July 2020
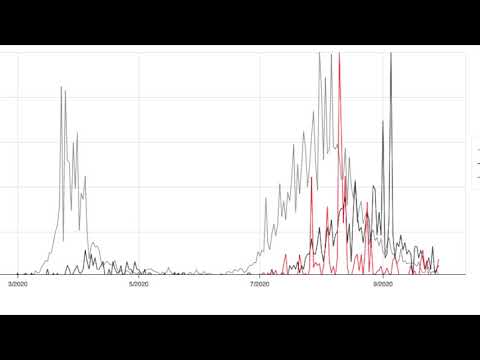
Number of Teams visits, the number of new Covid cases in Australia, and the number of new deaths in Australia per day.
Code here: numbers.ipynb
Use the panel on the right to zoom, pan, and scroll. NB: Microsoft Teams data only available from 2 July 2020
Percentage of Teams total visits, percentage of total new Covid cases in Australia, and percentage of total new deaths in Australia per day.
Code here: percentages.ipynb
Use the panel on the right to zoom, pan, and scroll. NB: Microsoft Teams data only available from 2 July 2020
Musical Figure.
This video sets the data in the above figure to pitches. One increase in percentage point equals one chromatic step (well, almost, the piano midi ran out of notes after about 80 percentage points). There are four layers:
-
Layer one, heard from 0:00: just that general sense of "Covid Normal" dread.
-
Layer two, heard from 0:18: The grey line, number of new cases.
-
Layer three, heard from 0:42: The black line, number of new deaths.
-
Layer four, heard from 2:13: The red line, number of DataCreatives teams site views.